Inflation and pump prices in Canada since 2018
CPI inflation peaked at 8.13% in 2022-06 and was 3.03% in 2026-08; prices overall are 24.5% above December 2019.
Published 2026-10-18 · OpenCanadaData
Latest weekly summary: Canada data this week: recalls, river levels, rinks and inflation (week of October 12, 2026)
- CPI inflation peaked at 8.13% in 2022-06.
- 12-month CPI change in 2026-08: 3.03%.
- Prices are 24.5% higher than in December 2019 (food +33.2%).
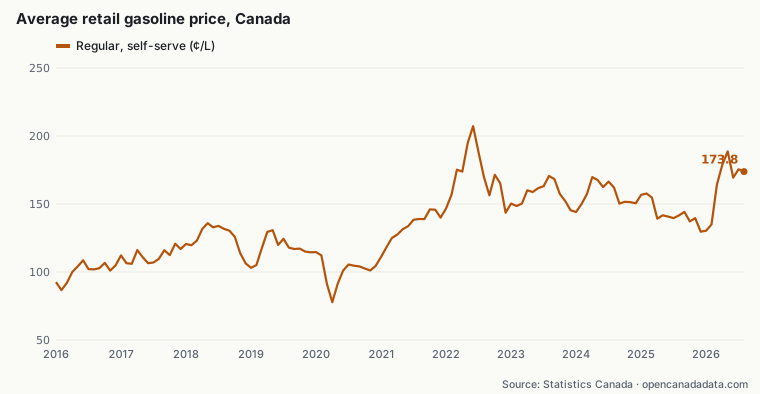
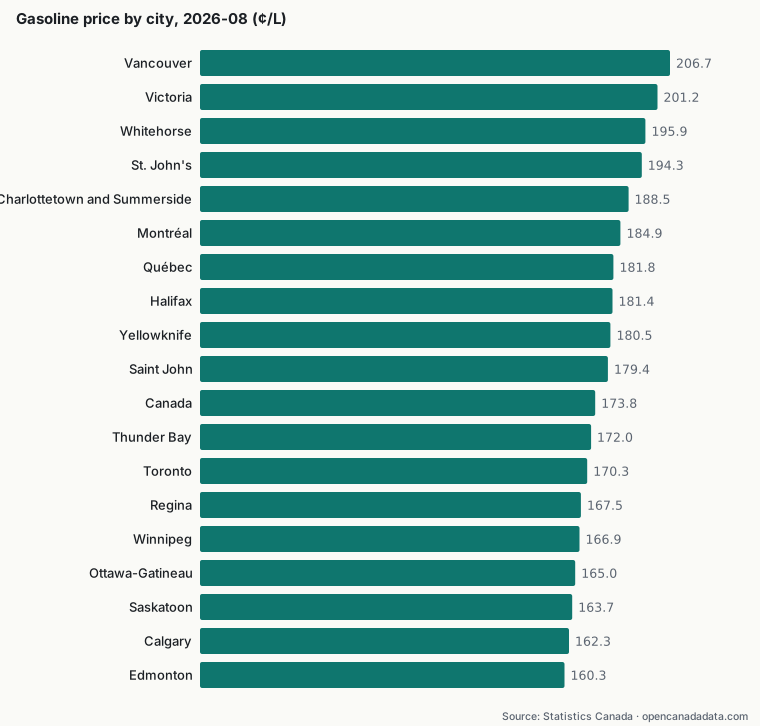
- Gasoline: 173.8¢/L nationally; Vancouver 206.7¢ vs Edmonton 160.3¢.
Statistics Canada's Consumer Price Index (CPI) and its monthly survey of retail gasoline prices are the most-watched measures of the cost of living. This article uses the official tables to show how inflation has moved since 2018, what happened to pump prices, and how prices compare between cities. The latest month available is 2026-08.
Inflation: from the 2022 peak back toward normal
All-items CPI inflation peaked at 8.13% year over year in 2022-06, the highest point in this series since 2018. In 2026-08, the 12-month change was 3.03%. Food prices were up 2.85% from a year earlier, shelter 1.54% and rent 2.81%.
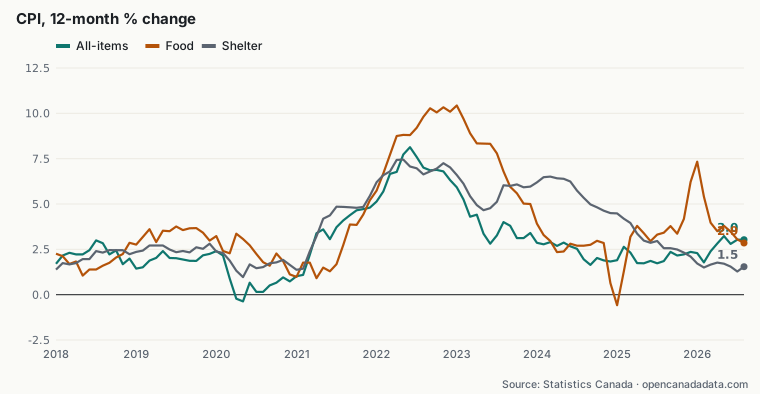
Year-over-year rates hide how much price levels have built up. Between December 2019 and 2026-08, the all-items index rose 24.5%. Food rose 33.2%, shelter 30.5% and rent 33.3%. The gasoline index rose 52.1% over the same period. Even when annual inflation slows, prices stay at their new higher level.
Pump prices
The national average price of regular self-serve gasoline peaked at 207.2¢ a litre in 2022-06 and stood at 173.8¢ in 2026-08. In the CPI, gasoline was 22.78% higher than a year earlier, by far the largest swing of the components shown here. Gasoline is volatile: oil prices, the exchange rate, refining margins and tax changes all pass through quickly. Year-over-year changes therefore partly reflect where prices were twelve months earlier.
Big gaps between cities
In 2026-08, the most expensive city in the survey was Vancouver, British Columbia at 206.7¢ a litre and the cheapest was Edmonton, Alberta at 160.3¢, a gap of 46.4¢. British Columbia cities and northern and Atlantic centres tend to sit at the top. Prairie cities sit near the bottom, reflecting differences in provincial fuel taxes and distribution costs.
Caveats
- CPI figures are not seasonally adjusted. Monthly comparisons should use the 12-month change, as here.
- City gasoline prices are survey averages for each urban centre and do not represent every station.
- These tables are revised only rarely, but always check the latest release on the Statistics Canada website.
A closer look: how persistent was the inflation?
From January 2021 to 2026-08, all-items inflation was above 3% in 35 of 68 months. Food inflation exceeded overall inflation in 52 of those months and peaked later than the headline rate, at 10.43% in 2023-01. Shelter inflation peaked at 7.45% in 2022-05. Different parts of the basket peaked at different times, which is why households felt the squeeze for longer than the headline peak suggests.
At the pump, the national average was 117.9¢ a litre in August 2019, compared with 173.8¢ in 2026-08. Every surveyed city got more expensive, but not equally. The largest increases were in Charlottetown and Summerside (+71.8¢), St. John's (+70.9¢) and Halifax (+67.2¢). The smallest were in Thunder Bay (+38.3¢) and Ottawa (+47.2¢). The gap between the most and least expensive city was 48.3¢ in August 2019 and 46.4¢ in 2026-08, so the spread between cities has stayed fairly stable even as the overall level rose.
Explore the data yourself
Every figure in this article can be checked. Each chart has a CSV download built from the same script output, and the sources section below links to the official datasets with the date we retrieved them. Browse the underlying records on the economy page, open any company profile to see all the records linked to it and how each one was matched, or use the corrections form if you spot an error.
Methodology
Monthly CPI index levels (table 18-10-0004-01, Canada, 2002=100) for all-items, food, shelter, rent and gasoline. Twelve-month changes are computed as index(month) / index(same month a year earlier) − 1, and cumulative changes as index(2026-08) / index(2019-12) − 1. Gasoline prices come from table 18-10-0001-01 (regular unleaded, self-service). All calculations were done with a Python script on the official CSVs. Our rounding may differ slightly from figures published by Statistics Canada, which are rounded from the published index.
Limitations and caveats
Correlation is not causation: lines that move together on a chart do not show that one caused the other. Company names are linked to profiles by exact normalized-name matching (plus province where available); different legal entities with similar names are not merged, and the same company may appear under several names. Figures describe what was reported to the government, not a finding of wrongdoing.
Sources and licences
- Consumer Price Index, monthly (Table 18-10-0004-01) — Statistics Canada. Licence : Statistics Canada Open Licence. Retrieved 2026-10-18.
Source: Statistics Canada, Consumer Price Index, monthly (Table 18-10-0004-01). Reproduced and distributed on an "as is" basis with the permission of Statistics Canada. This data is available free of charge from Statistics Canada; this product is not endorsed by Statistics Canada. - Monthly average retail prices for gasoline and fuel oil (Table 18-10-0001-01) — Statistics Canada. Licence : Statistics Canada Open Licence. Retrieved 2026-10-18.
Source: Statistics Canada, Monthly average retail prices for gasoline and fuel oil (Table 18-10-0001-01). Reproduced and distributed on an "as is" basis with the permission of Statistics Canada. This data is available free of charge from Statistics Canada; this product is not endorsed by Statistics Canada.
OpenCanadaData is an independent site, not affiliated with the Government of Canada. Original data is available free of charge from the official sources above. Report an error: support@opencanadadata.com
More insights
- Canada data this week: recalls, river levels, rinks and inflation (week of October 12, 2026)
- What 34,000 Health Canada recall notices show, and what they don't
- Canada's pollutant releases in 2024: where they come from
- Drug licences meet pollutant reports: the companies in both federal files
- Do vehicle recalls track gas prices? A lesson in reading two lines