Canada data this week: recalls, river levels, rinks and inflation (week of October 12, 2026)
33 recall notices, 409 river and lake stations up more than 10 cm in a month, Edmonton rinks still off-season, and 12-month inflation steady at 3.0%.
Published 2026-10-18 · OpenCanadaData
- Health Canada's recalls portal logged 33 notices dated October 12–18 (last-updated dates; the newest is 2026-10-16), down from 52 the week before.
- Three food recalls were Class 1, the highest risk level: undeclared peanut, undeclared wheat, and Listeria in organic cheeses.
- Of 2,090 hydrometric stations with a full 30 days of data, 409 rose more than 10 cm and 437 fell more than 10 cm; the median change was +0.4 cm.
- All 9 Edmonton outdoor rinks in the city's notification feed are still off-season; 3 carry an explicit 'Closed' notice.
- Consumer prices were 3.0% higher in 2026-08 than a year earlier, the same as in 2026-07; gasoline was up 22.8%.
This is our first weekly summary. Each week we take the datasets that refresh on OpenCanadaData, recompute a few simple measures, and write down what changed. Everything here is calculated by script from our own copies of the official files, retrieved on October 18, 2026. Where a measure has limits, we say so. Next week's edition will be linked from this page.
Recalls: fewer notices, but three high-risk food alerts
Our copy of the Health Canada recalls and safety alerts dataset has 33 records whose last-updated date falls between October 12 and 18. The previous week (October 5–11) had 52. The portal had not yet posted anything dated after 2026-10-16 when we retrieved it, so the weekend may still fill in.
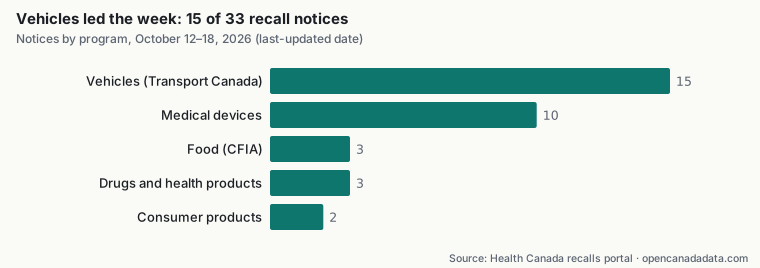
Vehicle notices from Transport Canada were the largest group (15). They were spread across 11 manufacturers, mostly heavy vehicles: buses, trucks and recreational trailers. Structural problems were the most common issue (5 notices). Medical devices came next (10). 9 of those were classed as performance issues, mostly laboratory analyzers and imaging systems used in hospitals rather than products bought by the public.
The notices most relevant to households were the three Class 1 food recalls from the Canadian Food Inspection Agency: Certain White Lotus Seed Paste Mooncake with 2 Egg Yolks recalled due to undeclared peanut (2026-10-16); Soup Time brand French Onion Soup recalled due to undeclared wheat (2026-10-16); Various brands of organic cheeses recalled due to Listeria monocytogenes (2026-10-14). Class 1 means there is a reasonable probability that eating the product could cause serious health problems. Three common pharmacy products, Aleve 200 mg caplets, Claritin Allergy Tablets 10 mg, Flintstones Complete Multivitamins and Minerals, were recalled from wholesalers because of a distribution error. Those notices concern the supply chain, not product safety.
Water levels: Ontario and B.C. rivers up, the North and Prairies down
We compared the average daily water level for the first three days and the last three days of each station's 30-day record (September 18 to October 17–18) across Environment and Climate Change Canada's real-time network. 2,090 stations had enough data. 7 more were left out because their records jumped by more than 2 m from one day to the next, which usually means a sensor or datum issue rather than a real change. Most stations barely moved: 1,244 changed by 10 cm or less.
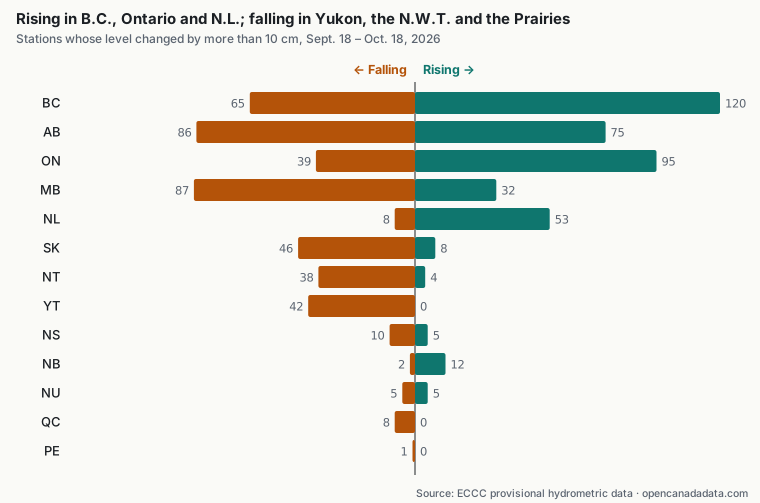
The regional pattern is clear. British Columbia had 120 stations rising versus 65 falling, as autumn rain arrived on the coast and in the interior. Ontario had 95 up and 39 down, and Newfoundland and Labrador 53 up and 8 down. In the other direction, Yukon had 42 stations falling and none rising, the Northwest Territories 38 falling, Manitoba 87 and Saskatchewan 46. That is typical of northern rivers receding before freeze-up and of Prairie reservoirs drawn down after summer.
| Station | Province | 30-day change (m) |
|---|---|---|
| Bear Brook Near Bourget | ON | +1.48 |
| Pine River At East Pine | BC | +1.42 |
| Fraser River At Shelley | BC | +1.38 |
| Yakoun River Near Port Clements | BC | +1.29 |
| South Nation River Near Plantagenet Springs | ON | +1.15 |
| St. Mary Reservoir Near Spring Coulee | AB | −2.91 |
| Porcupine River Near International Boundary | YT | −2.45 |
| Portage Reservoir Near Portage La Prairie | MB | −2.24 |
| Kinbasket Lake Below Garrett Creek | BC | −2.12 |
| Porcupine River Below Bell River | YT | −2.09 |
The biggest rises were on Bear Brook near Bourget and the South Nation River near Plantagenet Springs in eastern Ontario, and on the Fraser River at Shelley near Prince George. The largest drops include St. Mary Reservoir in southern Alberta and the Porcupine River in Yukon. Reservoir levels are managed, so a drop there reflects operations as much as weather. These are provisional real-time readings that ECCC may revise. Check the station page and local flood advisories before acting on them.
Edmonton rinks: still waiting for winter
The City of Edmonton's facility notifications feed lists 9 outdoor rink sites. All are off-season. 3 carry an explicit closure notice left over from last season, including Hawrelak Park Outdoor Ice Rinks ('The Hawrelak skating surface is closed for the 2026 season and will reopen in winter 26/27.'). The rest have no current notice. Outdoor ice usually depends on several consecutive cold days, so watch the Edmonton rinks page. It refreshes from the city's feed every hour, so status changes will show up there first.
Prices: inflation steady, gasoline still the outlier
Statistics Canada's latest Consumer Price Index (for 2026-08) shows prices 3.0% higher than a year earlier, unchanged from 2026-07 and up from 1.9% in 2025-08. Food was up 2.8%, rent 2.8% and shelter overall 1.5%. Energy rose 15.4% and gasoline 22.8%, so fuel is doing much of the work in the headline number.
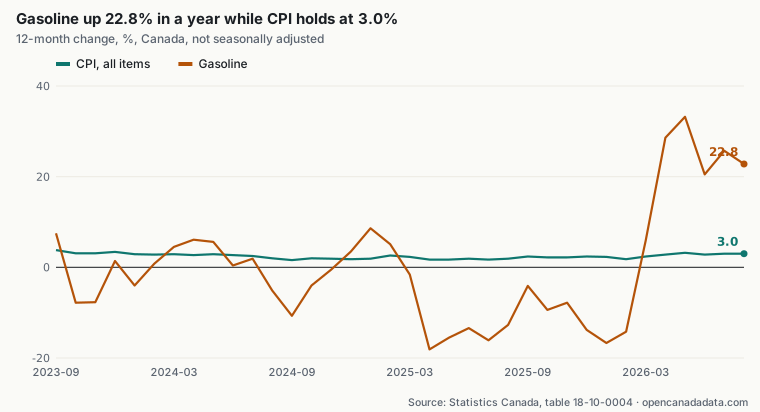
At the pump, Statistics Canada's average retail price for regular unleaded in 2026-08 ranged from 206.7¢ a litre in Vancouver to 160.3¢ in Edmonton, a gap of 46.4¢. More detail is on the economy page and in our earlier article on inflation and gasoline prices.
What this means for you
- If you have the recalled mooncakes, French onion soup or organic cheeses at home, check the lot codes on the linked notices and return or discard the product.
- If you live near a rising river in eastern Ontario or B.C., look up your nearest station on the water levels page, and follow your municipality's flood messages.
- Skaters in Edmonton: there is no outdoor ice yet. Bookmark the rinks page rather than calling around.
- Budgeting: overall inflation has held around 3%, but fuel costs are rising much faster. Compare city prices before a long drive.
- All figures, CSVs and charts may be reused with attribution. The full list of sources is on our data sources page.
Frequently asked questions
How many recalls did Health Canada post this week?
33 recall and alert notices on the federal recalls portal had a last-updated date from October 12 to 18, 2026, compared with 52 the week before. Three were Class 1 food recalls.
Are river levels rising in Canada right now?
It depends on the region. Of 2,090 stations with a full 30 days of data, 409 rose more than 10 cm and 437 fell more than 10 cm. Rises were concentrated in British Columbia, Ontario and Newfoundland and Labrador. Falls were concentrated in Yukon, the Northwest Territories, Manitoba and Saskatchewan.
What is Canada's inflation rate?
The Consumer Price Index was 3.0% higher in 2026-08 than a year earlier (Statistics Canada table 18-10-0004), the same as in 2026-07. Gasoline prices were up 22.8%.
Methodology
Recalls: records in our copy of Health Canada's Recalls and Safety Alerts dataset with a last-updated date from 2026-10-13 to 2026-10-16 (week of October 12–18), counted by the portal's program field; risk class as published. Water: provisional daily mean water levels from ECCC's real-time hydrometric files, September 18 to October 18, 2026. We included stations with at least 25 days of data covering the whole window and excluded 7 stations with any day-to-day jump over 2 m. Change = mean of the last three days minus mean of the first three days, rounded to the centimetre. Rinks: City of Edmonton facility notifications as of 2026-10-18. Prices: Statistics Canada table 18-10-0004 (CPI, not seasonally adjusted) 12-month changes computed from index levels, and table 18-10-0001 average retail prices for regular unleaded gasoline, self-service. Retrieved October 18, 2026.
Limitations and caveats
Correlation is not causation: lines that move together on a chart do not show that one caused the other. Company names are linked to profiles by exact normalized-name matching (plus province where available); different legal entities with similar names are not merged, and the same company may appear under several names. Figures describe what was reported to the government, not a finding of wrongdoing.
Sources and licences
- Recalls and safety alerts — Health Canada. Licence : Open Government Licence – Canada 2.0. Retrieved 2026-10-18.
Contains information licensed under the Open Government Licence – Canada. - Real-time hydrometric data (water level and flow) — Environment and Climate Change Canada (MSC Datamart). Licence : ECCC Data Servers End-use Licence. Retrieved 2026-10-18.
Data source: Environment and Climate Change Canada (provisional real-time hydrometric data), under the ECCC Data Servers End-use Licence. - Facility Notifications (Outdoor Ice Rinks) — City of Edmonton. Licence : Open Government Licence – City of Edmonton. Retrieved 2026-10-18.
Contains information licensed under the Open Government Licence – City of Edmonton. - Consumer Price Index, monthly (Table 18-10-0004-01) — Statistics Canada. Licence : Statistics Canada Open Licence. Retrieved 2026-10-18.
Source: Statistics Canada, Consumer Price Index, monthly (Table 18-10-0004-01). Reproduced and distributed on an "as is" basis with the permission of Statistics Canada. This data is available free of charge from Statistics Canada; this product is not endorsed by Statistics Canada. - Monthly average retail prices for gasoline and fuel oil (Table 18-10-0001-01) — Statistics Canada. Licence : Statistics Canada Open Licence. Retrieved 2026-10-18.
Source: Statistics Canada, Monthly average retail prices for gasoline and fuel oil (Table 18-10-0001-01). Reproduced and distributed on an "as is" basis with the permission of Statistics Canada. This data is available free of charge from Statistics Canada; this product is not endorsed by Statistics Canada.
OpenCanadaData is an independent site, not affiliated with the Government of Canada. Original data is available free of charge from the official sources above. Report an error: support@opencanadadata.com
More insights
- What 34,000 Health Canada recall notices show, and what they don't
- Canada's pollutant releases in 2024: where they come from
- Inflation and pump prices in Canada since 2018
- Drug licences meet pollutant reports: the companies in both federal files
- Do vehicle recalls track gas prices? A lesson in reading two lines