Do vehicle recalls track gas prices? A lesson in reading two lines
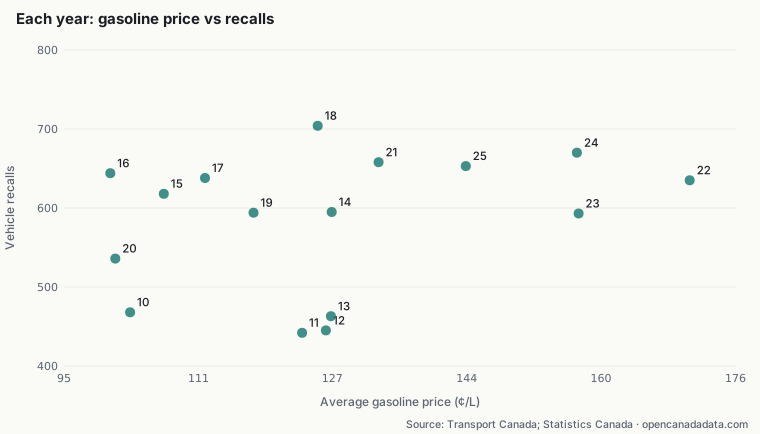
Across 2010–2025 the correlation is weak (r = 0.29). The make and vehicle type explain far more about recall counts.
Published 2026-10-18 · OpenCanadaData
Latest weekly summary: Canada data this week: recalls, river levels, rinks and inflation (week of October 12, 2026)
- 9,356 vehicle recall notices, 2010–2025.
- Correlation with annual average gasoline price: r = 0.29 (weak, 16 years).
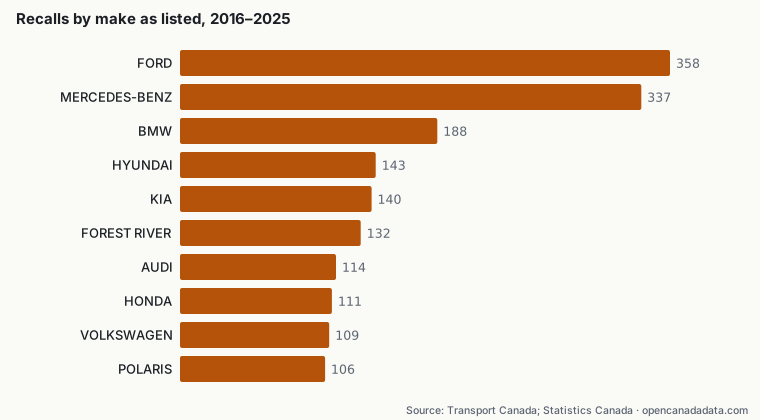
- Most notices 2016–2025: FORD (358) and MERCEDES-BENZ (337).
- SUVs are the most-recalled vehicle type.
Do vehicle recalls rise and fall with the cost of driving? This cross-dataset piece sets Transport Canada's Vehicle Recalls Database against Statistics Canada's monthly retail gasoline prices for 2010 to 2025. The short answer is that the two series share little beyond a broad upward drift, and the comparison mainly shows how easy it is to read too much into two lines on one chart.
Two series, one chart
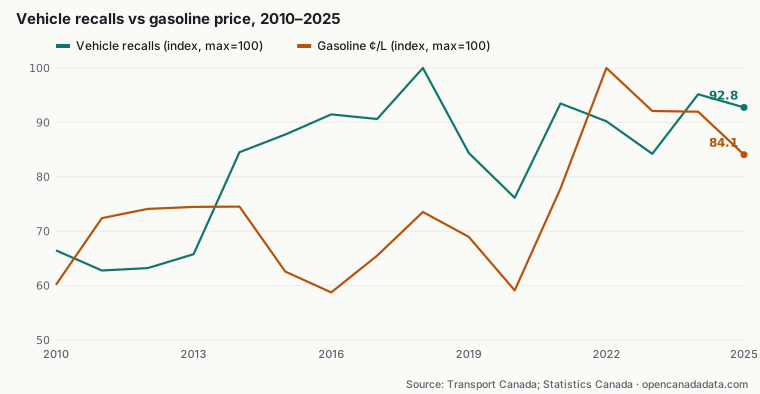
Transport Canada logged 9,356 vehicle recall notices from 2010 to 2025. Annual counts rose from an average of about 454 in 2010–2013 to about 628 in 2014–2025. The busiest year was 2018 (704), and 2020 saw a pandemic-year dip to 536. On an annual basis, gasoline averaged between 100.3¢ and 170.7¢ a litre, peaking in 2022.
A weak relationship
Plotting one point per year, the Pearson correlation between average gasoline price and the number of recalls is r = 0.29 over 16 years. That is weak, and with so few points it is not statistically meaningful. The 2022 gasoline spike did not come with a recall spike, and the 2018 recall peak came in a year of middling fuel prices. Both series trend upward over the period, and a shared trend alone can create a modest correlation.
There is no plausible direct mechanism here anyway. Recalls are triggered by defect investigations, manufacturer quality programs and regulatory activity, often years after a model is sold. Fuel prices affect what people buy and how much they drive, but not whether a part was built wrong. We publish the comparison as a worked example of the caution these charts call for.
What does drive the count: makes and vehicle types
From 2016 to 2025, the makes with the most notices (as listed by Transport Canada, sometimes grouping several brands) were FORD (358), MERCEDES-BENZ (337) and BMW (188). SUVs were the most-recalled vehicle type (1,472), ahead of cars (1,057). The number of notices partly reflects how many models and model years a manufacturer sells in Canada, and how it splits recalls into separate notices.
Caveats
- The database names the vehicle make, not the legal entity. These notices are therefore not linked to company profiles.
- The 'units affected' field contains some implausibly large values (hundreds of millions for single label recalls in 2024), so we do not chart units.
- Counts are notices, not vehicles. A single defect can produce several notices.
A closer look: the mix of vehicles is shifting
Comparing 2016–2020 with 2021–2025 shows how the recall mix has changed. SUV notices went from 562 to 910, while car notices went from 652 to 405. Motorhome notices changed from 314 to 246 and RV trailers from 312 to 290. These shifts may partly reflect changes in what Canadians buy, but the recall database alone cannot measure sales, so we do not draw that conclusion here.
The ten makes with the most notices from 2016 to 2025 account for 27% of all notices, out of 489 distinct make labels in the file. Some labels combine several brands from one manufacturer, so the true number of manufacturers is lower. Notices also vary by month. Using two-digit month numbers, the busiest month across those ten years was 12 (600 notices) and the quietest was 01 (394), so the peak falls in winter rather than the summer driving season. That fits our view that driving activity and fuel prices are not what set the recall calendar.
Explore the data yourself
Every figure in this article can be checked. Each chart has a CSV download built from the same script output, and the sources section below links to the official datasets with the date we retrieved them. Browse the underlying records on the recalls page, open any company profile to see all the records linked to it and how each one was matched, or use the corrections form if you spot an error.
Methodology
Vehicle recall notices were counted by the year of their recall date in the Transport Canada Vehicle Recalls Database. Annual gasoline prices are simple means of the twelve monthly national averages (regular unleaded, self-service, table 18-10-0001-01); 2026 is excluded because the year is incomplete. The Pearson correlation was computed on the 16 annual pairs. On the line chart, both series are scaled to their own maximum so their shapes can be compared on one axis; the scaling does not change the correlation.
Limitations and caveats
Correlation is not causation: lines that move together on a chart do not show that one caused the other. Company names are linked to profiles by exact normalized-name matching (plus province where available); different legal entities with similar names are not merged, and the same company may appear under several names. Figures describe what was reported to the government, not a finding of wrongdoing.
Sources and licences
- Motor vehicle safety recalls database — Transport Canada. Licence : Open Government Licence – Canada 2.0. Retrieved 2026-10-18.
Contains information licensed under the Open Government Licence – Canada. - Monthly average retail prices for gasoline and fuel oil (Table 18-10-0001-01) — Statistics Canada. Licence : Statistics Canada Open Licence. Retrieved 2026-10-18.
Source: Statistics Canada, Monthly average retail prices for gasoline and fuel oil (Table 18-10-0001-01). Reproduced and distributed on an "as is" basis with the permission of Statistics Canada. This data is available free of charge from Statistics Canada; this product is not endorsed by Statistics Canada.
OpenCanadaData is an independent site, not affiliated with the Government of Canada. Original data is available free of charge from the official sources above. Report an error: support@opencanadadata.com
More insights
- Canada data this week: recalls, river levels, rinks and inflation (week of October 12, 2026)
- What 34,000 Health Canada recall notices show, and what they don't
- Canada's pollutant releases in 2024: where they come from
- Inflation and pump prices in Canada since 2018
- Drug licences meet pollutant reports: the companies in both federal files