Canada's pollutant releases in 2024: where they come from
Alberta has 42% of reporting facilities; the ten largest sites account for 22% of all tonnage.
Published 2026-10-18 · OpenCanadaData
Latest weekly summary: Canada data this week: recalls, river levels, rinks and inflation (week of October 12, 2026)
- 7,738 facilities reported about 2,988,676 tonnes of releases for 2024.
- Alberta: 3,267 facilities and 34% of tonnage.
- Top 10 facilities = 22% of tonnage; top 100 = 57%.
- Median facility: about 26 tonnes.
Every year, thousands of Canadian facilities report their pollutant releases to the National Pollutant Release Inventory (NPRI), run by Environment and Climate Change Canada. For the 2024 reporting year, our copy contains 7,738 facilities belonging to 2,754 organizations. Their combined releases of substances reported in tonnes or kilograms add up to about 2,988,676 tonnes.
Alberta leads by facility count and by tonnage
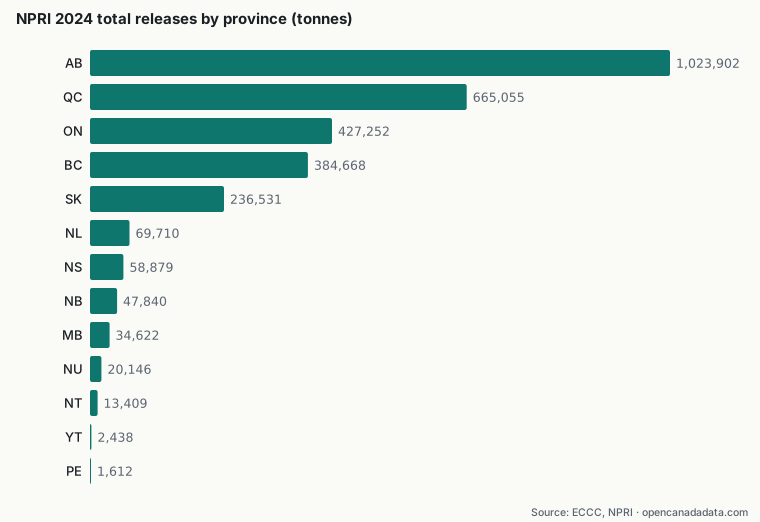
Alberta accounts for 3,267 reporting facilities (42% of the national count) and about 1,023,902 tonnes of releases (34% of the total). Quebec ranks second by tonnage with 665,055 tonnes from only 793 facilities. Most of Quebec's total comes from a handful of aluminum smelters. Ontario has the second-largest number of facilities (1,631) but ranks third by tonnage (427,252 tonnes).
A few industries, and a few sites, dominate
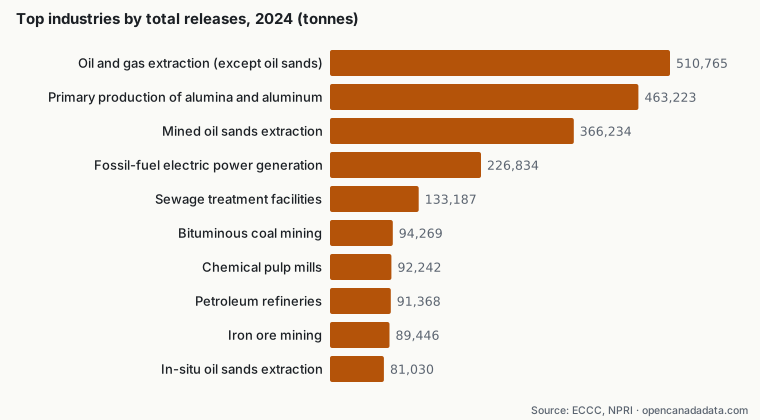
Conventional oil and gas extraction is by far the most common reporting industry (3,485 facilities, mostly small well sites and batteries). It also has the largest combined total, 510,765 tonnes or 17% of everything reported. Primary aluminum production comes next with 463,223 tonnes from just 12 facilities, followed by mined oil sands extraction (366,234 tonnes from 8 sites).
Releases are highly concentrated. The ten largest facilities account for 22% of total tonnage and the top 100 for 57%. The median facility reported about 26 tonnes. The table below lists the ten largest facilities exactly as they are named in the inventory.
| Facility | Prov. | Industry | Tonnes |
|---|---|---|---|
| Aluminerie Alouette inc. | QC | Primary production of alumina and aluminum | 99,502 |
| Suncor Energy Inc. Oil Sands | AB | Mined oil sands extraction | 93,908 |
| Syncrude Canada Ltd | AB | Mined oil sands extraction | 91,542 |
| Usine Alma | QC | Primary production of alumina and aluminum | 70,966 |
| Kearl Oil Sands Processing Plant and Mine | AB | Mined oil sands extraction | 60,186 |
| Poplar River Power Station | SK | Fossil-fuel electric power generation | 56,223 |
| Aluminerie de Bécancour inc. | QC | Primary production of alumina and aluminum | 53,442 |
| Rio Tinto Alcan Inc. | BC | Primary production of alumina and aluminum | 50,553 |
| Fort Hills Oil Sands | AB | Mined oil sands extraction | 44,003 |
| Aluminerie de Baie-Comeau | QC | Primary production of alumina and aluminum | 41,374 |
Which substances make up the tonnage
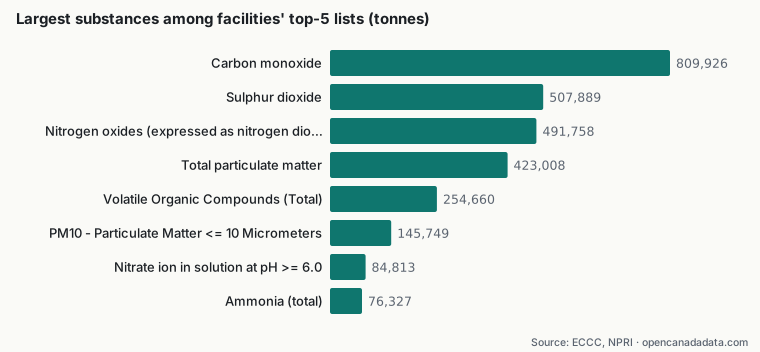
Most of the tonnage is made up of common air pollutants (criteria air contaminants): carbon monoxide, sulphur dioxide, nitrogen oxides and particulate matter. Summing each facility's five largest substances, carbon monoxide comes to about 809,926 tonnes and sulphur dioxide to 507,889 tonnes. A tonne of carbon monoxide and a tonne of a toxic metal are not equivalent, so a high total does not mean higher health risk.
What this does not tell you
- NPRI reporting is required only above set thresholds, so small emitters are missing and coverage varies by sector.
- Totals mix substances with very different toxicity. Greenhouse gases are reported in a separate program (GHGRP) that is not included here.
- Reported releases are the facilities' own estimates under federal rules. They are not violations and are not measured exposure.
A closer look: many small reporters, a few giants
The inventory is dominated by small reports. 1,791 of the 7,738 facilities (23%) reported less than one tonne of releases in total, and 3,029 (39%) reported less than ten tonnes. Many of these are upstream oil and gas sites that must report because of their combined air emissions, even though each one is small.
Average release per facility tells a different story from the provincial totals. Among provinces and territories with at least 20 reporting facilities, the highest average belongs to NL (about 1,267 tonnes per facility), followed by QC (839) and NB (736). Alberta's average is only about 313 tonnes, because its thousands of small well sites pull the mean down. By industry, mined oil sands extraction averages about 45,779 tonnes per facility and primary aluminum about 38,602.
Some operators report for hundreds of sites. Canadian Natural Resources Limited appears on 418 facility reports with about 86,095 tonnes combined, Cenovus Energy Inc. on 169 and Whitecap Resources Inc. on 147. In total, 109 organizations are linked to ten or more facilities. Company totals depend on how operators split their reporting entities, so they should be compared with care.
Explore the data yourself
Every figure in this article can be checked. Each chart has a CSV download built from the same script output, and the sources section below links to the official datasets with the date we retrieved them. Browse the underlying records on the emissions page, open any company profile to see all the records linked to it and how each one was matched, or use the corrections form if you spot an error.
Methodology
Each NPRI facility record on this site carries its 2024 total releases (to air, water and land, excluding road dust). We summed substances reported in tonnes and converted kilograms to tonnes; substances reported in grams, such as dioxins and furans, are left out. Province and industry (NAICS) come from the inventory. Substance totals add up each facility's five largest substances as stored in our database, so they understate the national total for each substance. Facility and company names are shown exactly as reported.
Limitations and caveats
Correlation is not causation: lines that move together on a chart do not show that one caused the other. Company names are linked to profiles by exact normalized-name matching (plus province where available); different legal entities with similar names are not merged, and the same company may appear under several names. Figures describe what was reported to the government, not a finding of wrongdoing.
Sources and licences
- National Pollutant Release Inventory (NPRI) – facility data, 2024 — Environment and Climate Change Canada. Licence : Open Government Licence – Canada 2.0. Retrieved 2026-10-18.
Contains information licensed under the Open Government Licence – Canada.
OpenCanadaData is an independent site, not affiliated with the Government of Canada. Original data is available free of charge from the official sources above. Report an error: support@opencanadadata.com
More insights
- Canada data this week: recalls, river levels, rinks and inflation (week of October 12, 2026)
- What 34,000 Health Canada recall notices show, and what they don't
- Inflation and pump prices in Canada since 2018
- Drug licences meet pollutant reports: the companies in both federal files
- Do vehicle recalls track gas prices? A lesson in reading two lines