What 34,000 Health Canada recall notices show, and what they don't
Volume dipped in 2020–2022 and rebounded. Medical devices, food and drugs make up 40% of the record.
Published 2026-10-18 · OpenCanadaData
Latest weekly summary: Canada data this week: recalls, river levels, rinks and inflation (week of October 12, 2026)
- 34,254 recall and alert records, dated 1991–2026.
- Busiest year by last update: 2014 (2,550); quietest: 2022 (1,218).
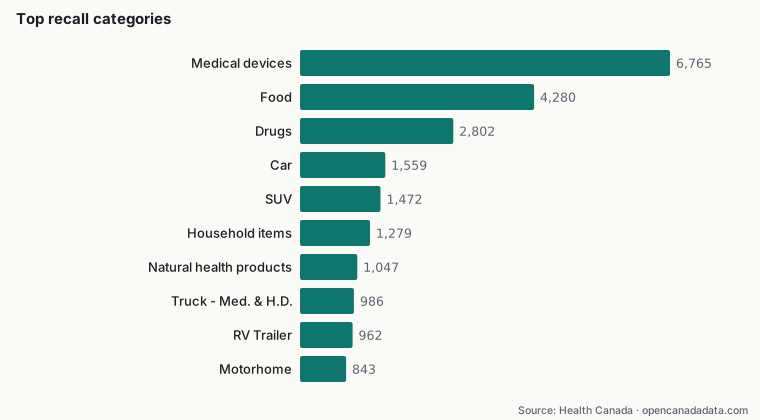
- Medical devices are the largest category overall (6,765 records).
- 18,223 records carry no hazard class.
Health Canada's Recalls and Safety Alerts open dataset is one of the most-used public safety files in the country. Our copy holds 34,254 records whose dates run from 1991 to 2026-10-16. It covers food, drugs, natural health products, medical devices, consumer products and, through the federal recalls portal, vehicles. This article looks at what the file shows about the volume and mix of recalls over time, and at what it cannot show.
Volume: a dip in 2020–2022, then a rebound
Counting records by the year of their last update, the busiest year between 2011 and 2025 was 2014 with 2,550 records and the quietest was 2022 with 1,218. From 2015 to 2019 the file averaged about 2,044 records a year. That fell to about 1,280 a year in 2020–2022, then rose again to about 1,922 a year in 2023–2025. So far in 2026 (to 2026-10-16), 1,425 records have been added or updated.
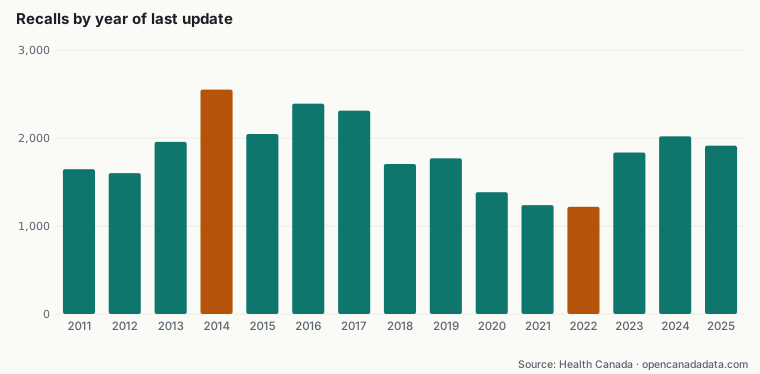
The 2020–2022 dip lines up with the pandemic years, but the dataset does not say why it happened. It could reflect fewer recalls, fewer updates to old notices, or changes in how the portal is maintained. Because the date field is the last-updated date, a notice first published in 2014 and edited in 2023 counts in 2023. The chart is a view of activity in the file, not a strict count of new recalls.
What gets recalled
Across all years, the three largest categories are medical devices (6,765), food (4,280) and drugs (2,802). Together they make up 40.4% of all records. Vehicle categories (car, SUV, medium and heavy trucks, RV trailers, motorhomes) together form another large block, because Transport Canada notices are cross-listed on the same portal.
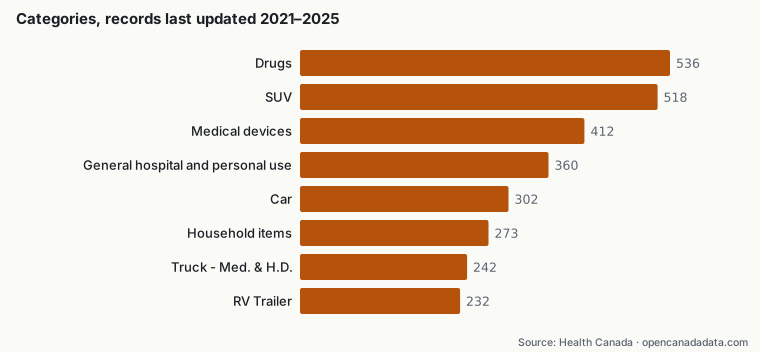
The mix looks different for the most recent five years. Among records last updated from 2021 to 2025, the largest category is drugs (536), followed by SUV (518) and medical devices (412). Medical devices dominate the full history but rank lower in recent updates. One likely reason is that a large backlog of older device notices is archived and never edited.
Hazard classes are recorded inconsistently
Health Canada uses different classification systems for different programs, such as Type I–III for health products and Class 1–3 for foods. In our copy, 18,223 records have no class at all. Comparing severity across categories is therefore unreliable without going back to each notice, and we do not attempt it here.
Reading the data responsibly
- A recall is a corrective action, often started voluntarily by the company. It is not a penalty and does not by itself mean a company acted improperly.
- The open file does not name the recalling company in a structured field, so these records are not linked to company profiles on this site.
- Counts depend on how notices are split. One problem may produce several notices, one per product, size or lot.
A closer look: who issues the notices
The portal pools notices from several programs, and the program field shows how uneven the contributions are. Transport Canada accounts for 9,943 records, Health Canada's medical devices program for 8,686, the Canadian Food Inspection Agency for 5,331 and consumer product safety for 5,217. Drugs and health products contribute 1,941. Any change in how one program publishes to the portal can move the national total, even if nothing changed in the marketplace.
Food is a clear example. Food records counted by last update fell from 398 in 2016 to 225 in 2020 and 168 in 2021, and our copy of this dataset holds only 3 food records last updated in 2024–2025. That almost certainly reflects where and how food recalls are published, not a collapse in food recalls, so the 2023–2025 rebound in the overall count is driven by other programs. Readers interested in food should check CFIA's own recall listings.
About 42% of all records (14,446) are flagged as archived. Among records last updated from 2021 to 2025, the most common issue labels are performance (1,215), labelling and packaging (357) and medical devices (330). The 'performance' label is used mostly for vehicle notices, which again points to Transport Canada as the main driver of recent volume.
Explore the data yourself
Every figure in this article can be checked. Each chart has a CSV download built from the same script output, and the sources section below links to the official datasets with the date we retrieved them. Browse the underlying records on the recalls page, open any company profile to see all the records linked to it and how each one was matched, or use the corrections form if you spot an error.
Methodology
We counted every record in our copy of the Recalls and Safety Alerts dataset (retrieved 2026-10-18) by the year of its last-updated date, by its category field and by its hazard-class field. We did not deduplicate records. Years 2011–2025 are charted because they are complete calendar years. A Python script computed the counts directly from the official file, with no manual edits.
Limitations and caveats
Correlation is not causation: lines that move together on a chart do not show that one caused the other. Company names are linked to profiles by exact normalized-name matching (plus province where available); different legal entities with similar names are not merged, and the same company may appear under several names. Figures describe what was reported to the government, not a finding of wrongdoing.
Sources and licences
- Recalls and safety alerts — Health Canada. Licence : Open Government Licence – Canada 2.0. Retrieved 2026-10-18.
Contains information licensed under the Open Government Licence – Canada.
OpenCanadaData is an independent site, not affiliated with the Government of Canada. Original data is available free of charge from the official sources above. Report an error: support@opencanadadata.com
More insights
- Canada data this week: recalls, river levels, rinks and inflation (week of October 12, 2026)
- Canada's pollutant releases in 2024: where they come from
- Inflation and pump prices in Canada since 2018
- Drug licences meet pollutant reports: the companies in both federal files
- Do vehicle recalls track gas prices? A lesson in reading two lines