Smokestacks, pharmacies and paycheques: three datasets, ten provinces
Alberta dominates pollutant reporting while Ontario and Quebec hold 49% of drug-product companies. Jobs track demographics more than industry.
Published 2026-10-18 · OpenCanadaData
Latest weekly summary: Canada data this week: recalls, river levels, rinks and inflation (week of October 12, 2026)
- Heavy industry (NPRI) is concentrated in Alberta, Quebec and Ontario.
- Drug-product companies (DPD) are concentrated in Ontario and Quebec.
- Employment rates follow demographics more closely than industry.
- Ten provinces is too few points for strong statistical conclusions.
Canada's provinces have very different economic profiles, and federal open data shows this from several angles at once. This piece sets three green datasets side by side for the ten provinces: NPRI pollutant reporting (heavy industry), Drug Product Database company addresses (pharmaceutical and health-product business), and the Labour Force Survey employment rate (the overall job market).
Two different industrial maps
Heavy industry clusters in the West. Alberta has 3,267 NPRI facilities and about 1,023,902 tonnes of 2024 releases, more than any other province on both counts. Health-product companies cluster in Central Canada: Ontario (1,106) and Quebec (642) together hold 49% of all organizations with DPD products, counting the 1,432 foreign or address-less holders in the total. Alberta has only 113 DPD companies.
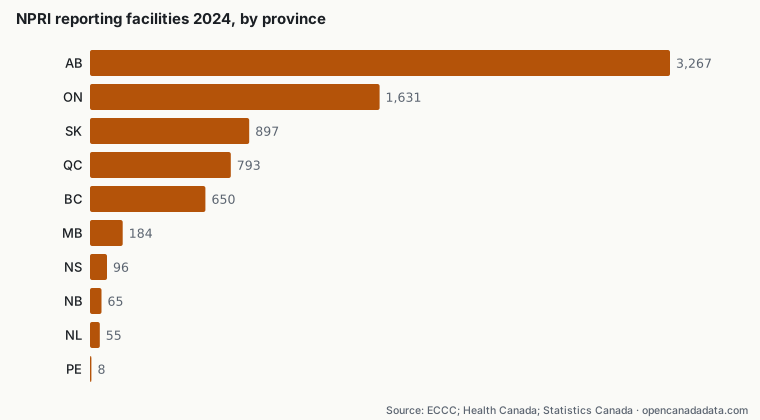
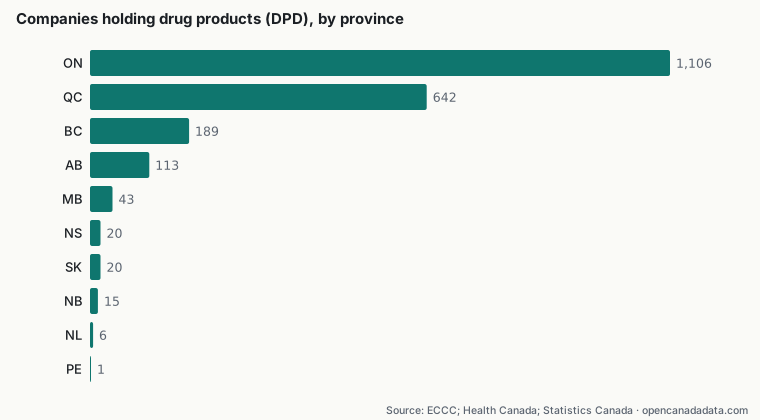
Quebec is the one province that ranks high on both maps: 665,055 tonnes of releases, much of it from aluminum smelting, and 642 drug-product companies. Newfoundland and Labrador shows how a few large sites can dominate a small province's numbers: 69,710 tonnes from just 55 facilities.
Jobs and pollution: no simple link
Do provinces with more industrial releases have stronger job markets? In 2026-09, Alberta had the highest employment rate (64.5%) and Alberta also had the largest releases, while Newfoundland and Labrador had the lowest rate (51.9%). Across the ten provinces, the Pearson correlation between employment rate and NPRI tonnage is r = 0.44. With only ten points that number is fragile: leaving Alberta out changes it to r = 0.20.
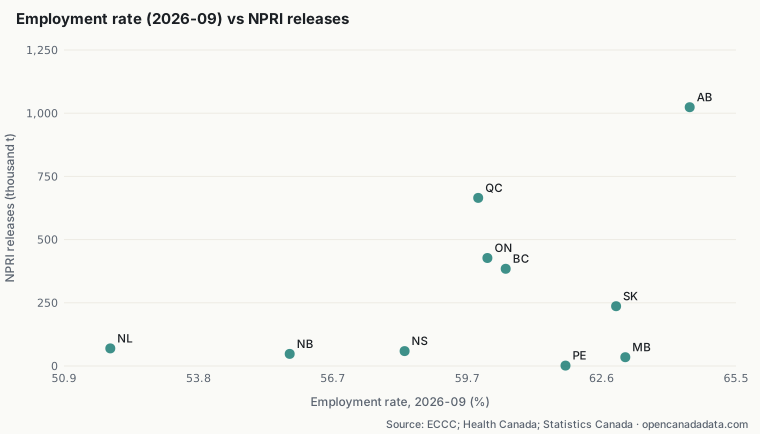
Employment rates are driven largely by demographics, especially the share of retirees, which is higher in Atlantic Canada and lower in Alberta. Emissions do not drive them. In Alberta, a young working-age population and a resource economy happen to coincide. The chart should not be read as 'more pollution, more jobs'.
| Province | NPRI facilities | NPRI t (2024) | DPD companies | DPD products | Employment rate 2026-09 |
|---|---|---|---|---|---|
| AB | 3,267 | 1,023,902 | 113 | 926 | 64.5% |
| QC | 793 | 665,055 | 642 | 19,745 | 59.9% |
| ON | 1,631 | 427,252 | 1,106 | 25,393 | 60.1% |
| BC | 650 | 384,668 | 189 | 1,757 | 60.5% |
| SK | 897 | 236,531 | 20 | 112 | 62.9% |
| NL | 55 | 69,710 | 6 | 10 | 51.9% |
| NS | 96 | 58,879 | 20 | 86 | 58.3% |
| NB | 65 | 47,840 | 15 | 35 | 55.8% |
| MB | 184 | 34,622 | 43 | 977 | 63.1% |
| PE | 8 | 1,612 | 1 | 1 | 61.8% |
Caveats
- DPD province is the company's mailing address, which is often a head office rather than a manufacturing site.
- NPRI totals exclude gram-reported substances and greenhouse gases. Territories are left out because the employment series used here covers provinces only.
- These are three snapshots taken at different times (NPRI 2024, DPD as retrieved, Labour Force Survey 2026-09).
A closer look: intensity, not just size
Totals reward big provinces, so it helps to look at ratios. Average NPRI releases per reporting facility are highest in NL (about 1,267 tonnes), QC (839) and NB (736). Alberta ranks lower on this measure (about 313 tonnes) because thousands of small oil and gas sites report alongside its oil sands mines. A province with few but very large sites, such as a smelter or a mine, looks intense per facility even when its total is modest.
On the health-product side, the average number of DPD products per company is highest in QC (about 31), ON (23) and MB (23). Ontario and Quebec combine many companies with large portfolios, because the large generic manufacturers are headquartered there. Smaller provinces have a handful of holders with few products each, and the 1432 holders without a Canadian address (mostly foreign manufacturers) sit outside this provincial picture entirely. Taken together, the ratios show two industrial geographies that barely overlap: resource extraction and smelting in the West, Newfoundland and Labrador and parts of Quebec, and health-product manufacturing in the Toronto and Montréal regions.
Explore the data yourself
Every figure in this article can be checked. Each chart has a CSV download built from the same script output, and the sources section below links to the official datasets with the date we retrieved them. Browse the underlying records on the emissions page, open any company profile to see all the records linked to it and how each one was matched, or use the corrections form if you spot an error.
Methodology
NPRI facilities and tonnes are summed by the province reported for each facility (2024). DPD companies are counted once per company profile by the province of the company's address; 1432 holders without a Canadian province (mostly foreign) are excluded from the provincial bars but included in the national total used for shares. The employment rate is the seasonally adjusted Labour Force Survey estimate for people aged 15 and over (table 14-10-0287-01) for 2026-09. The Pearson r was computed across the ten provinces.
Limitations and caveats
Correlation is not causation: lines that move together on a chart do not show that one caused the other. Company names are linked to profiles by exact normalized-name matching (plus province where available); different legal entities with similar names are not merged, and the same company may appear under several names. Figures describe what was reported to the government, not a finding of wrongdoing.
Sources and licences
- National Pollutant Release Inventory (NPRI) – facility data, 2024 — Environment and Climate Change Canada. Licence : Open Government Licence – Canada 2.0. Retrieved 2026-10-18.
Contains information licensed under the Open Government Licence – Canada. - Drug Product Database (DPD) — Health Canada. Licence : Open Government Licence – Canada 2.0. Retrieved 2026-10-18.
Contains information licensed under the Open Government Licence – Canada. - Labour force characteristics, monthly (Table 14-10-0287-01) — Statistics Canada. Licence : Statistics Canada Open Licence. Retrieved 2026-10-18.
Source: Statistics Canada, Labour force characteristics, monthly (Table 14-10-0287-01). Reproduced and distributed on an "as is" basis with the permission of Statistics Canada. This data is available free of charge from Statistics Canada; this product is not endorsed by Statistics Canada.
OpenCanadaData is an independent site, not affiliated with the Government of Canada. Original data is available free of charge from the official sources above. Report an error: support@opencanadadata.com
More insights
- Canada data this week: recalls, river levels, rinks and inflation (week of October 12, 2026)
- What 34,000 Health Canada recall notices show, and what they don't
- Canada's pollutant releases in 2024: where they come from
- Inflation and pump prices in Canada since 2018
- Drug licences meet pollutant reports: the companies in both federal files